Aug 2023
Lahaina, Maui
A wildfire can consume a neighborhood in hours. What comes after — mapping the damage, tracking what's rebuilt, what's abandoned — takes years. This archive follows both timescales: the Palisades & Eaton fires, mapped from satellite data in the days after they burned, and Lahaina, still being counted building by building two years on.
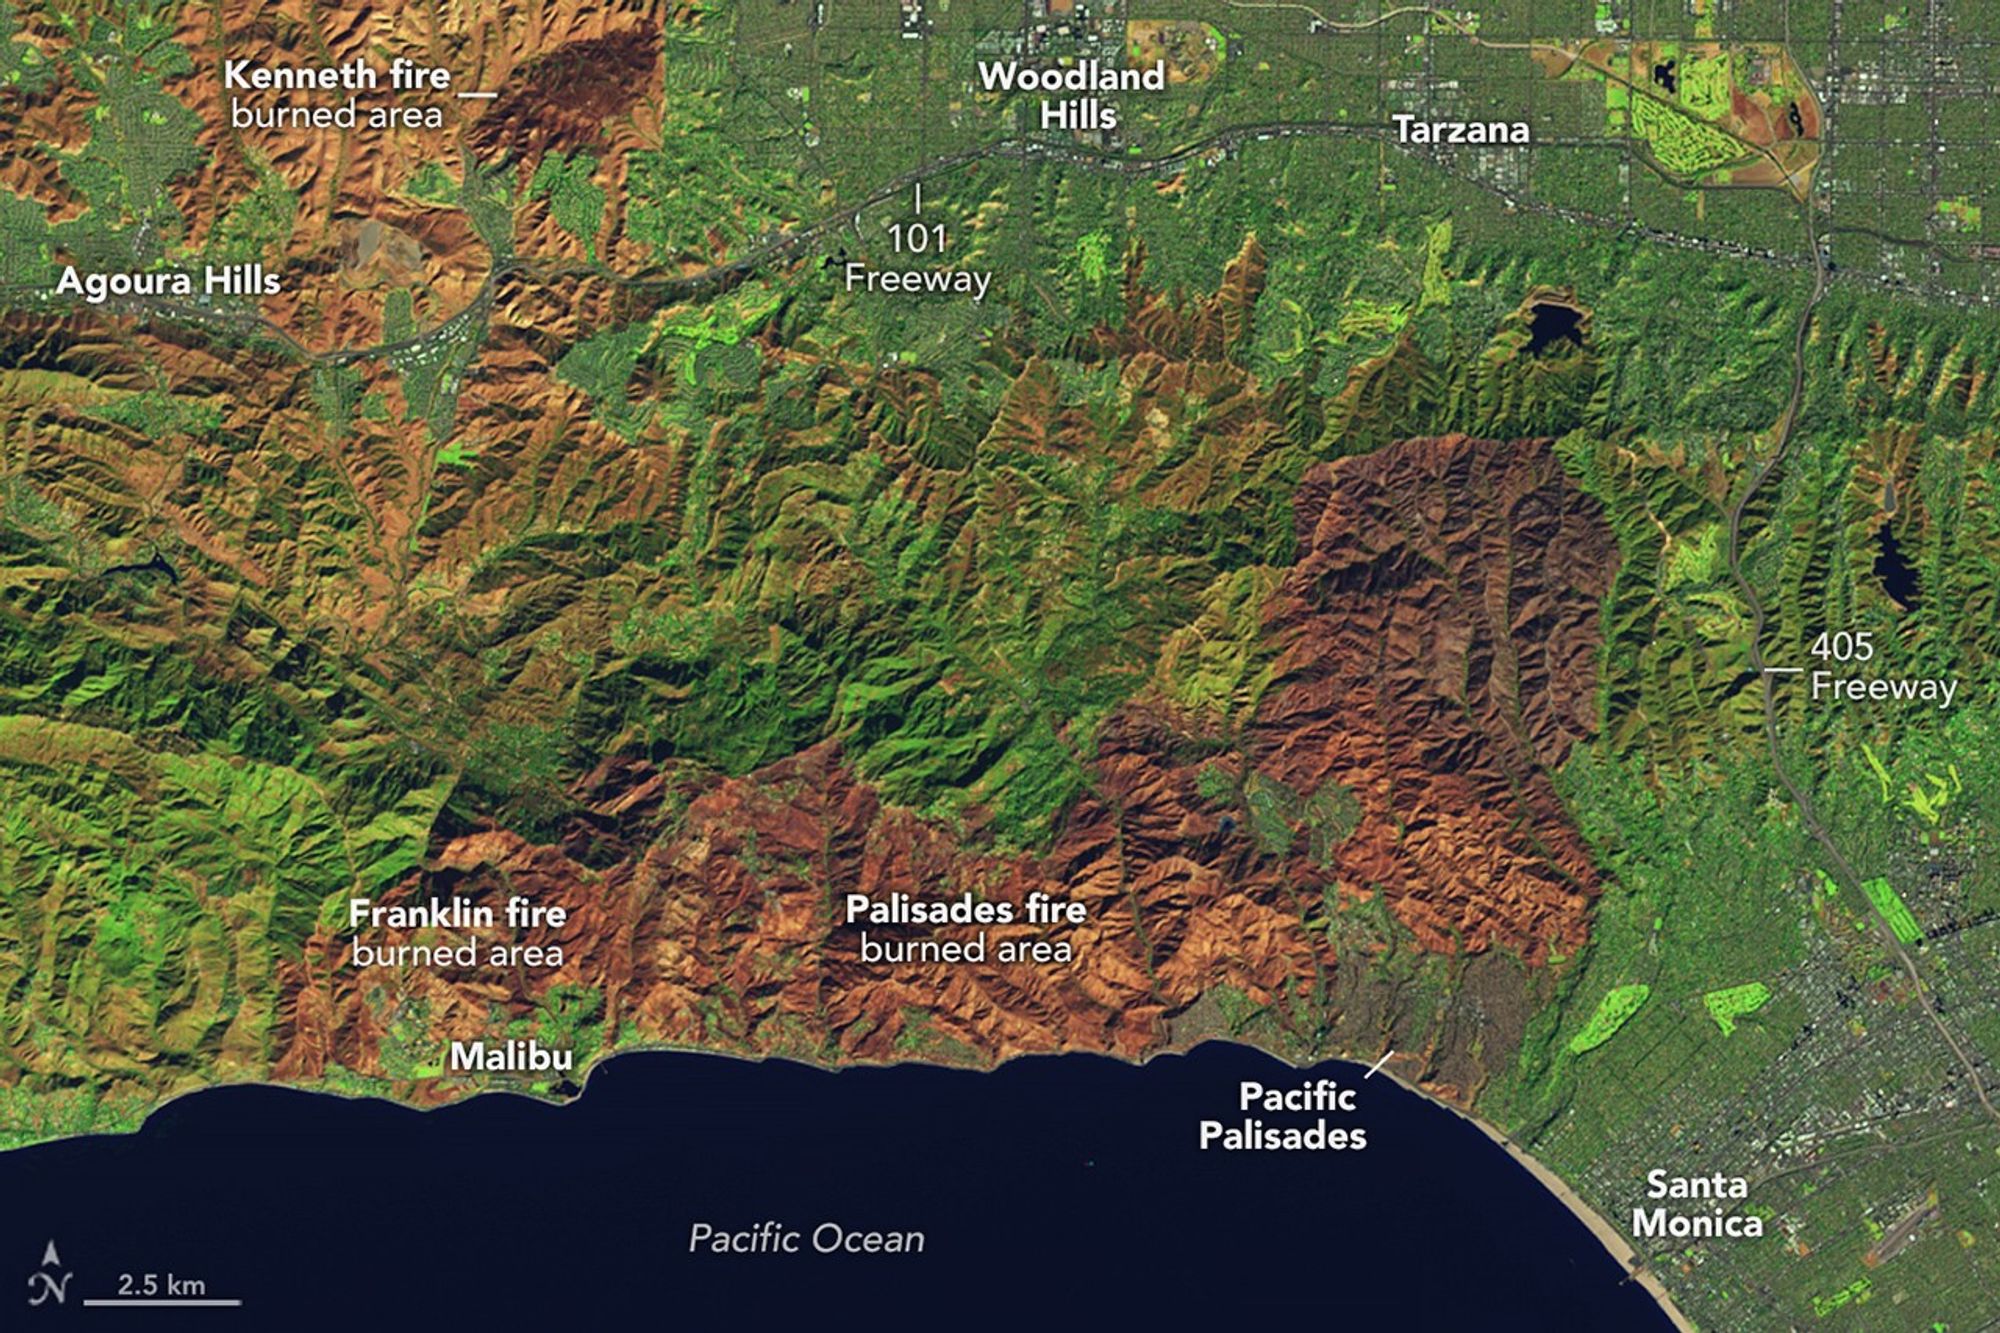
Background: Landsat 9 false-color image of the Palisades fire burn scar, Jan 14 2025 — NASA Earth Observatory
A fire's damage gets counted twice — once while it's still burning, and again, much later, when the question changes.
In the days right after a fire, the priority is figuring out how bad it is and where. Much later, the question shifts from "how much burned" to "what's actually coming back."
The Palisades & Eaton case study belongs to the first kind of count. It's a from-scratch satellite burn-severity analysis — pulling Sentinel-2 imagery, computing a differenced Normalized Burn Ratio (dNBR), and mapping the fire scar without waiting on any official damage assessment. The question here is how close open data and open-source tools alone can get to the official numbers.
The Lahaina case study belongs to the second kind. Instead of the fire, it tracks individual building footprints — comparing what was still standing eleven days after the August 2023 fire against what was standing again in 2025. Two years is not long enough to finish rebuilding a town; drag the divider on that map and you can see exactly how far short of "recovered" it still is.
A note on the numbers: the building counts on this page are raw detections from a computer-vision model reading satellite imagery, not an official survey. The 848 → 952 figure is the net change in detected building footprints between the two dates — a reasonable proxy for rebuilding activity, not a precise count of which structures were rebuilt.
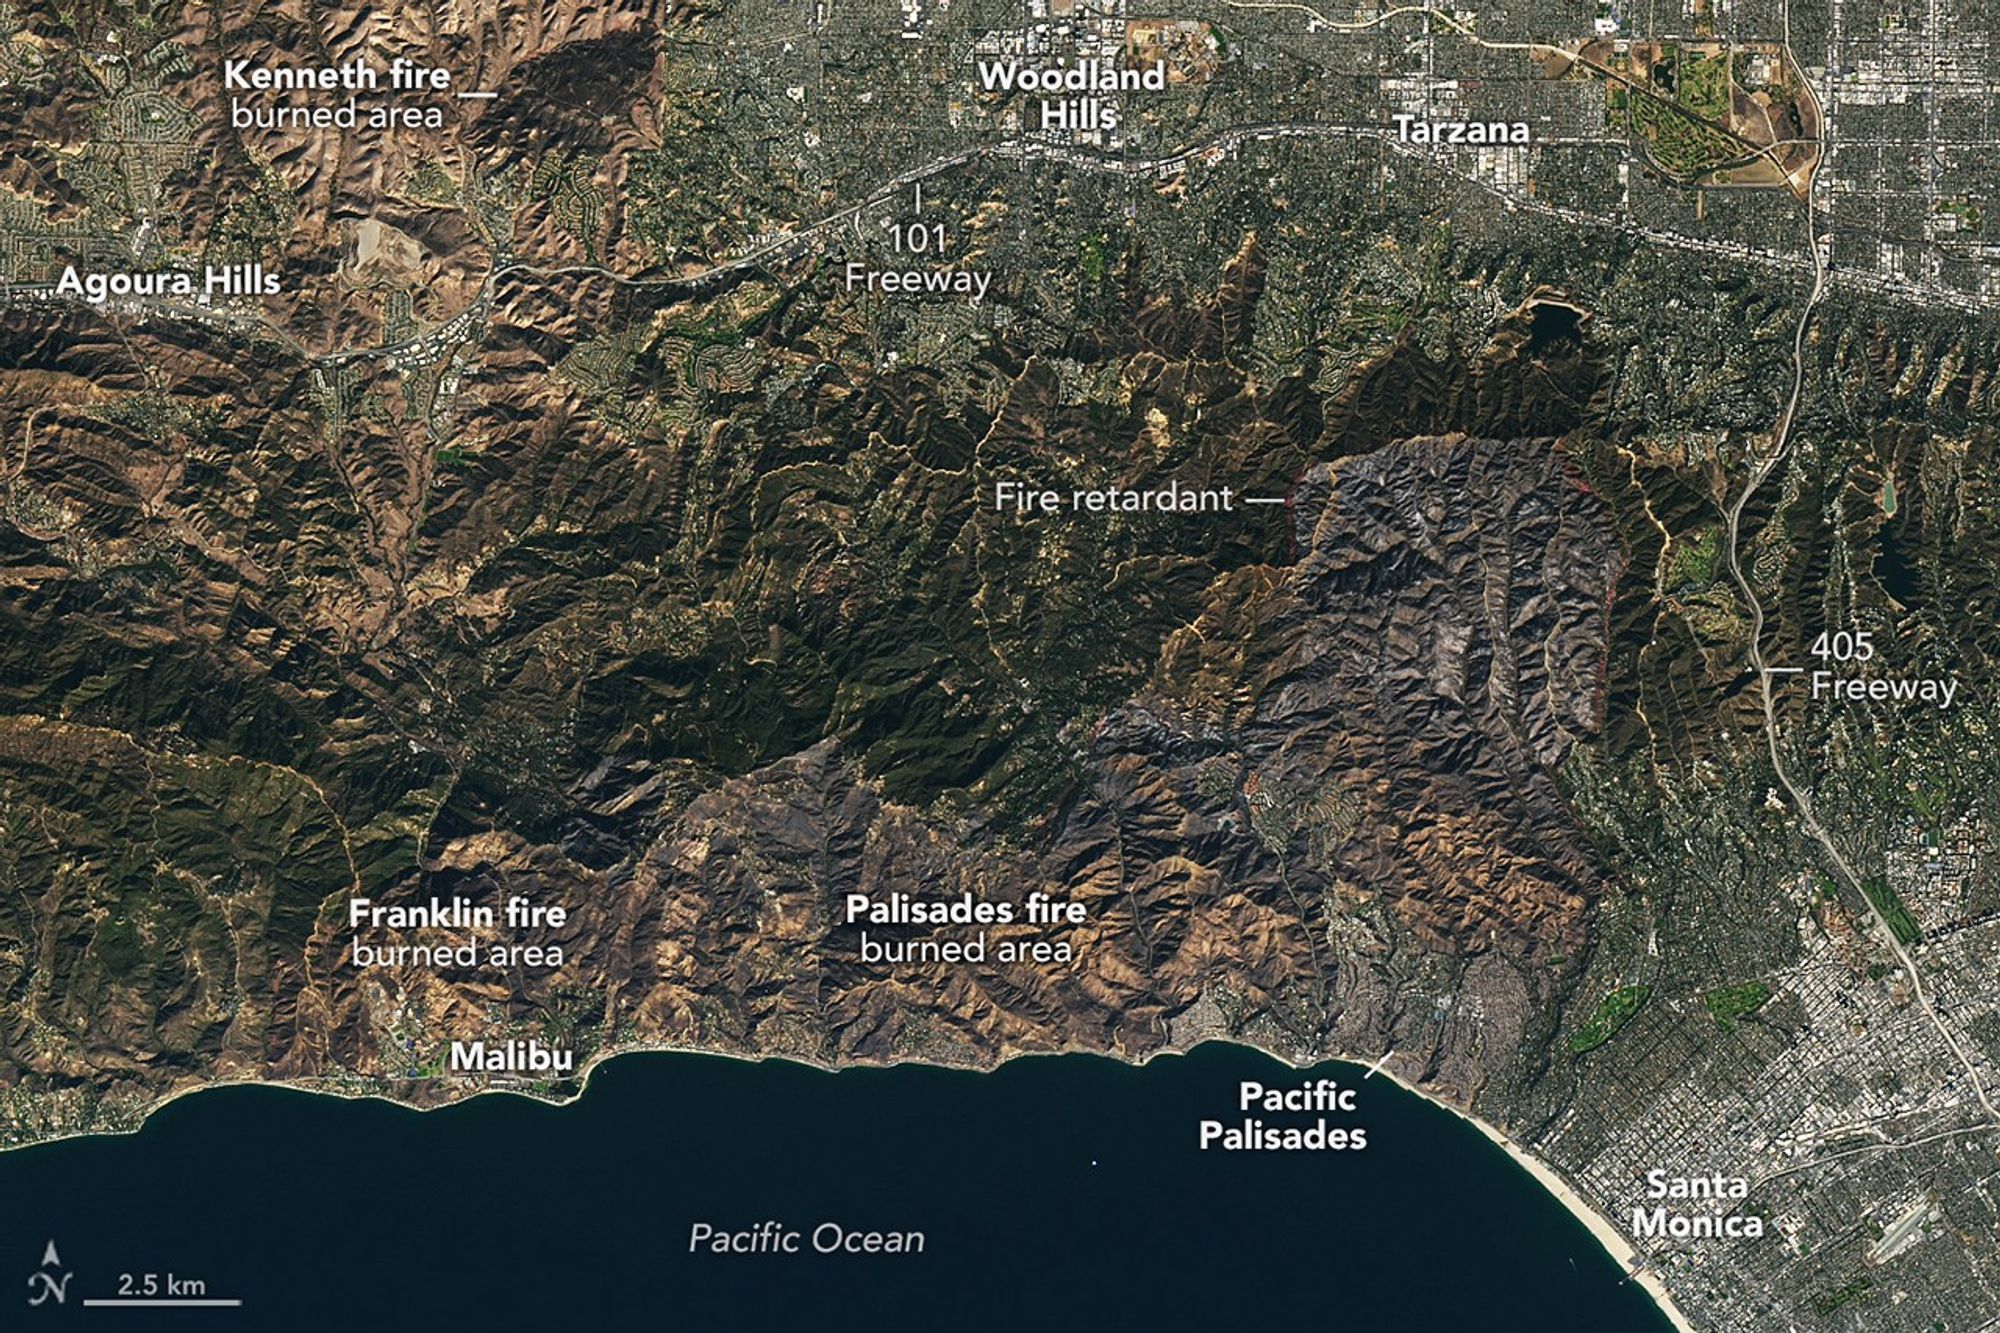
A satellite burn-severity analysis using free Sentinel-2 imagery and open-source dNBR methods — mapping 115.18 km² of fire scar and comparing our independent estimate against official reported acreage.
Open the analysis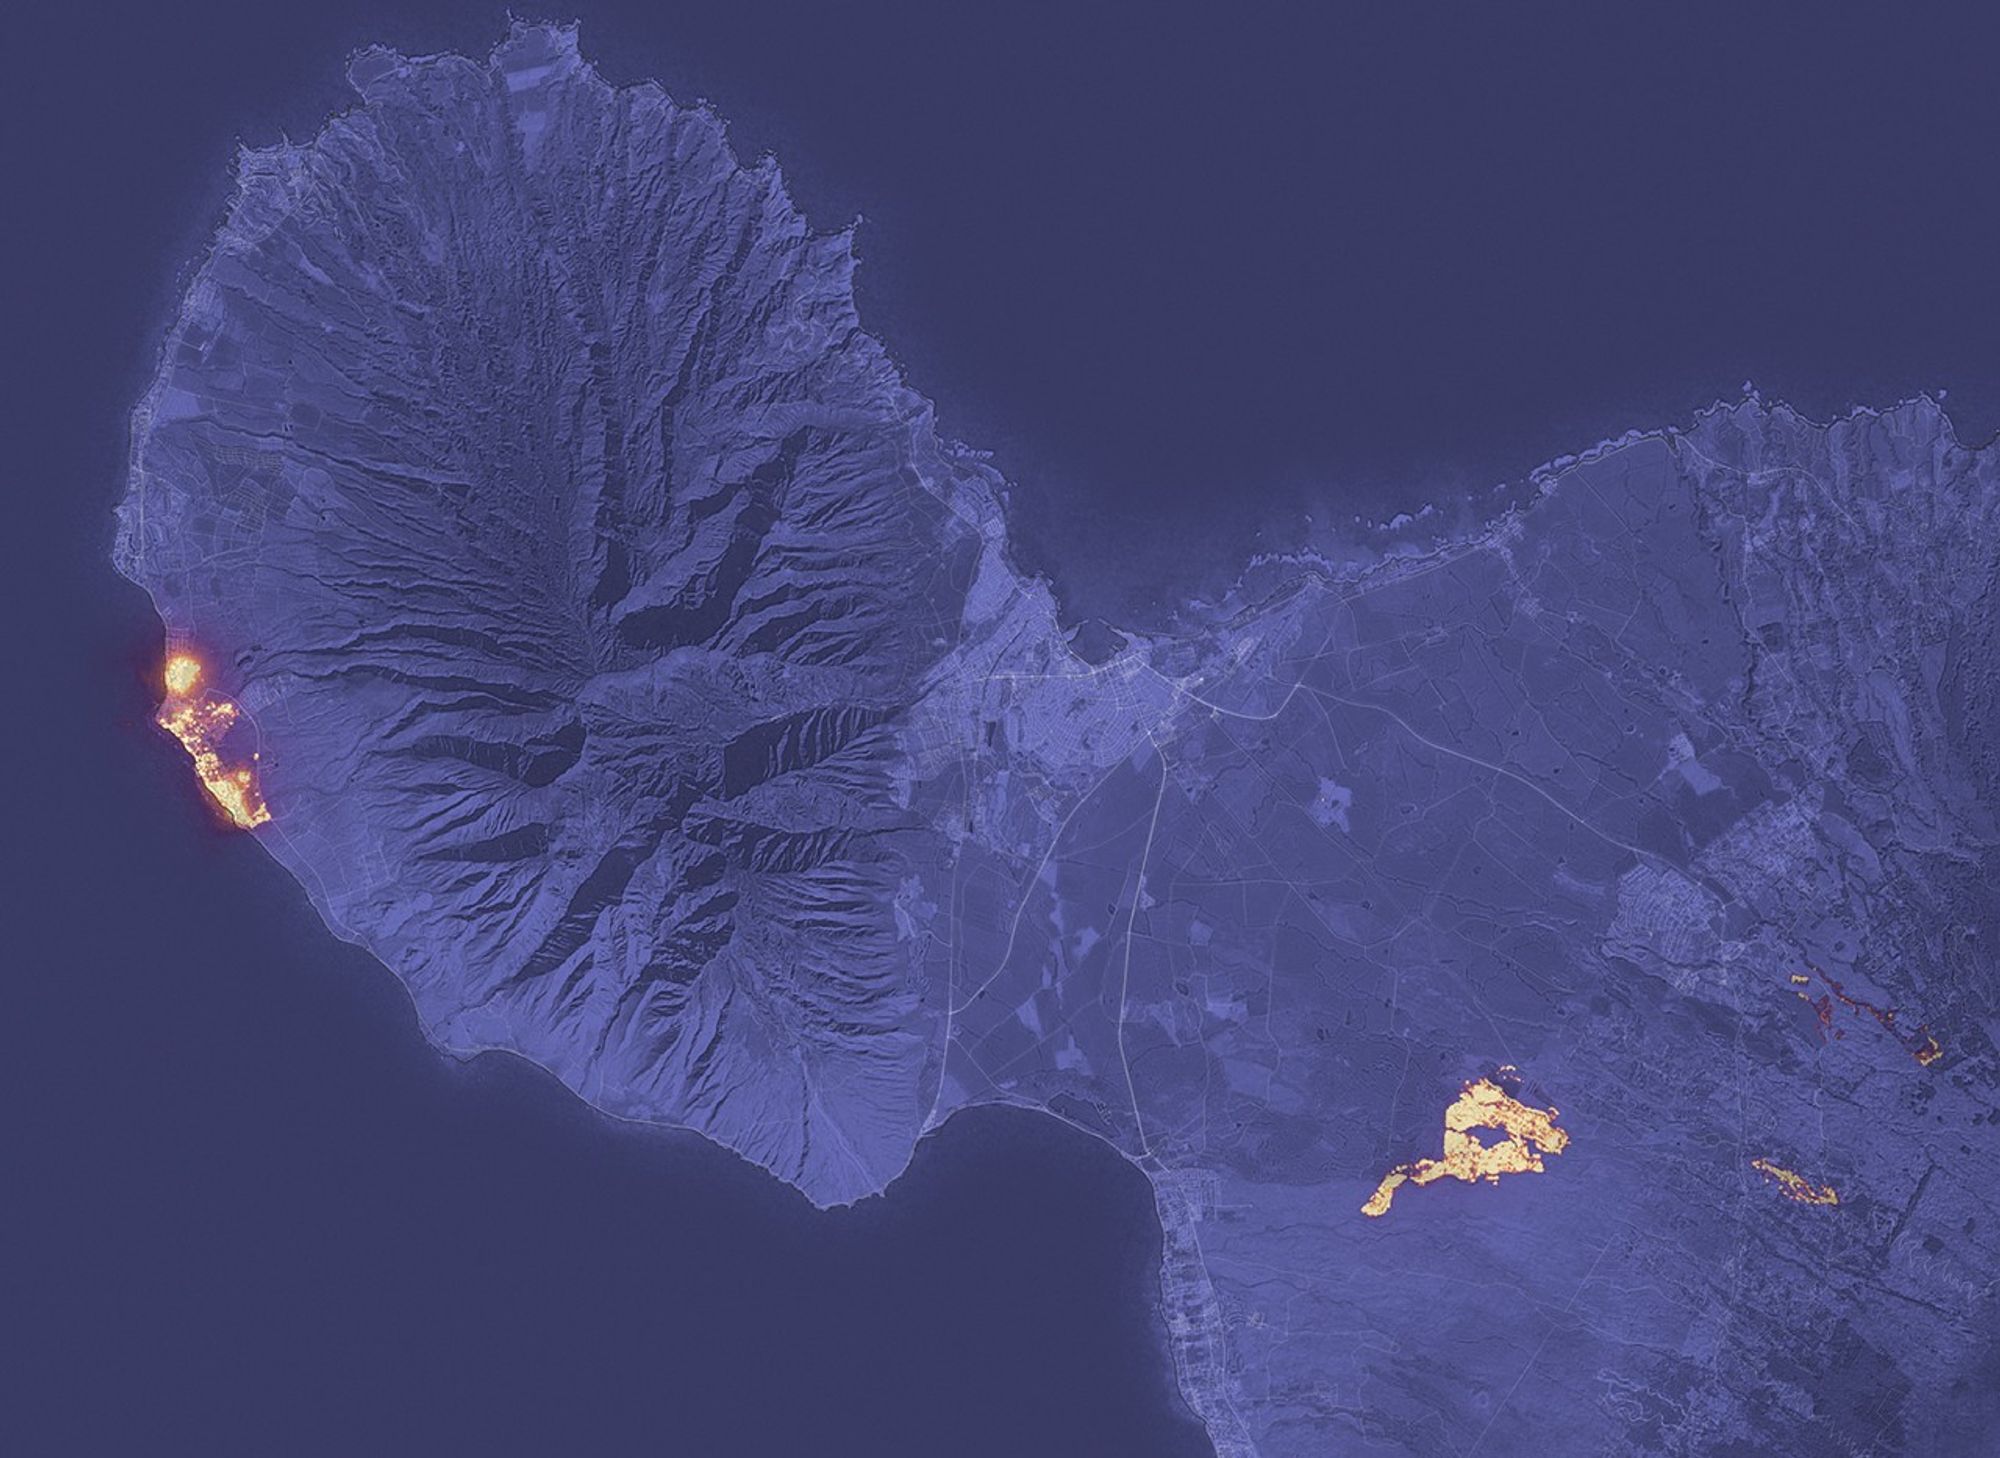
A side-by-side comparison map of Lahaina's building footprints — the post-fire state from August 2023 against the 2025 recovery survey — swipeable, building by building.
Open the comparison map